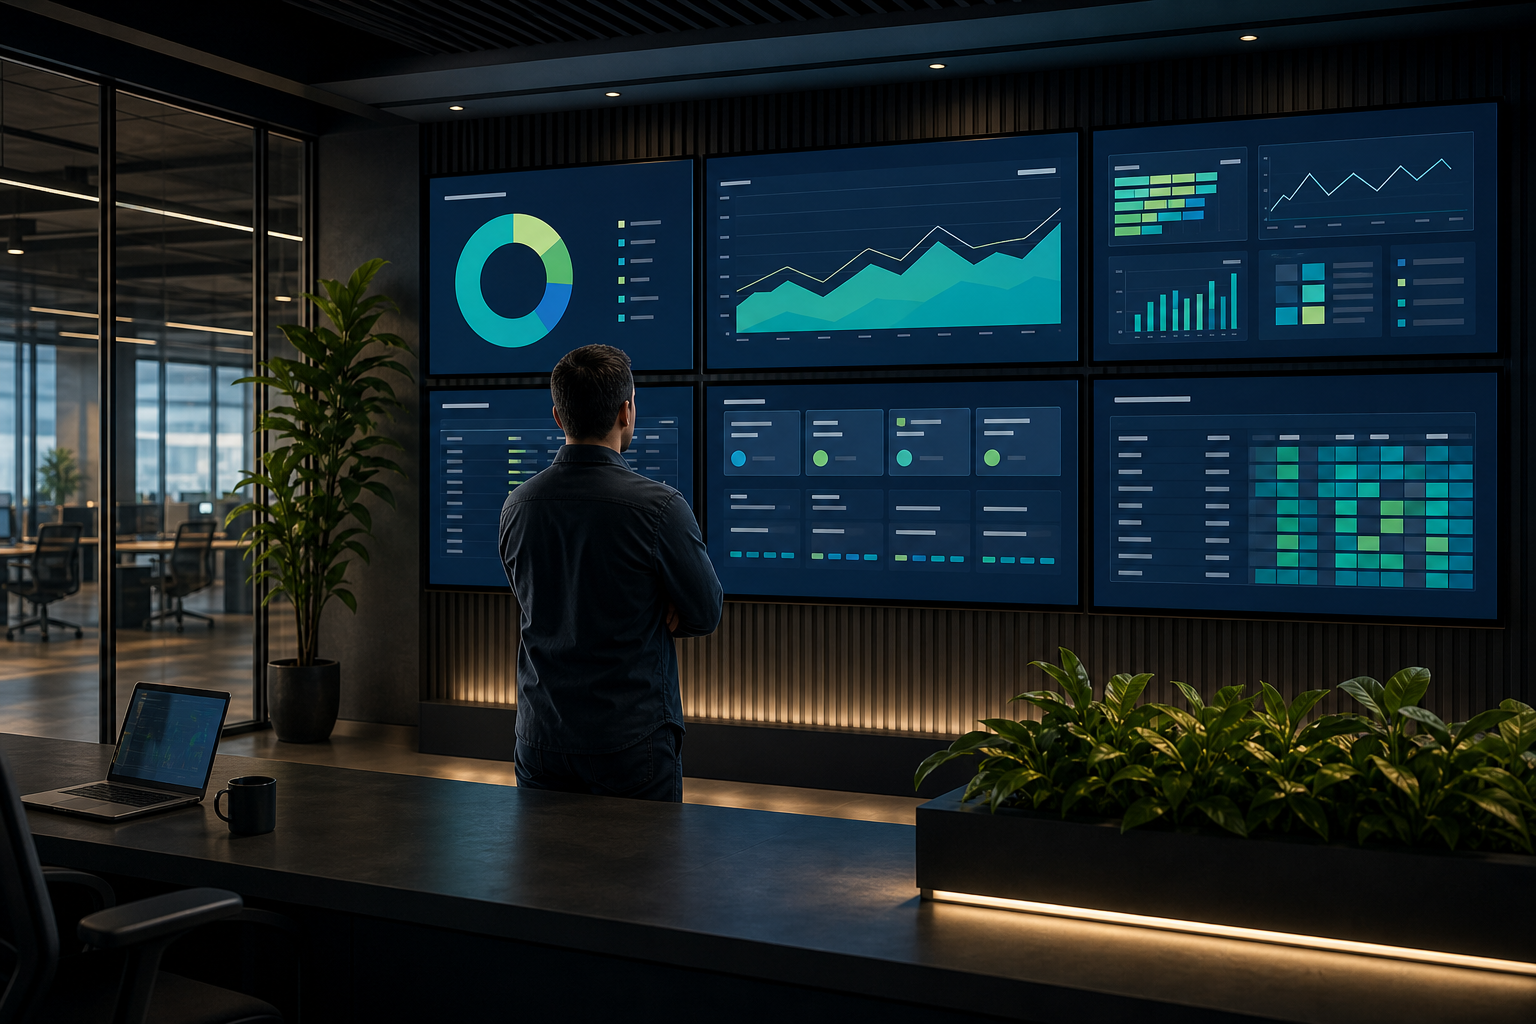

A dashboard can contain accurate data and still fail its audience. If viewers need to stop, zoom in, decode a legend, or remember what a color means, the visualization is not doing enough work.
The best data visualization for a dashboard screen is the one that makes the intended decision obvious with minimal effort. That usually means choosing the chart according to the question being asked, then simplifying it for viewing distance, screen size, and refresh frequency.
This guide explains how to choose charts, evaluate data visualization tools, and create dashboard examples that work on shared screens as well as individual monitors.
What data visualization means on a shared screen#
Data visualization is the graphical representation of information so people can identify patterns, comparisons, changes, or exceptions more easily than they could from raw tables.
On a shared dashboard screen, visualization has an additional constraint: viewers may see it from several feet away and may look at it for only a few seconds. The design must support quick interpretation rather than extended analysis.
A useful shared-screen visualization should answer four questions quickly:
- What is happening? Show the current value or state.
- Is it normal? Provide a target, threshold, or useful comparison.
- Is it changing? Show a trend when time matters.
- Does someone need to act? Make exceptions visible without relying only on color.
A detailed analyst workspace can support filters, hover states, and many dimensions. A display in a reception area, operations center, classroom, or production floor usually needs a clearer hierarchy:
- The most important status or metric.
- The main trend or comparison.
- Supporting detail for context.
- A visible indication of ownership or next action, where relevant.
Displaying a dashboard on a screen does not automatically make it a good digital-signage visualization. The dashboard still needs to be designed for the environment in which it will be viewed.
How to choose the right chart type#
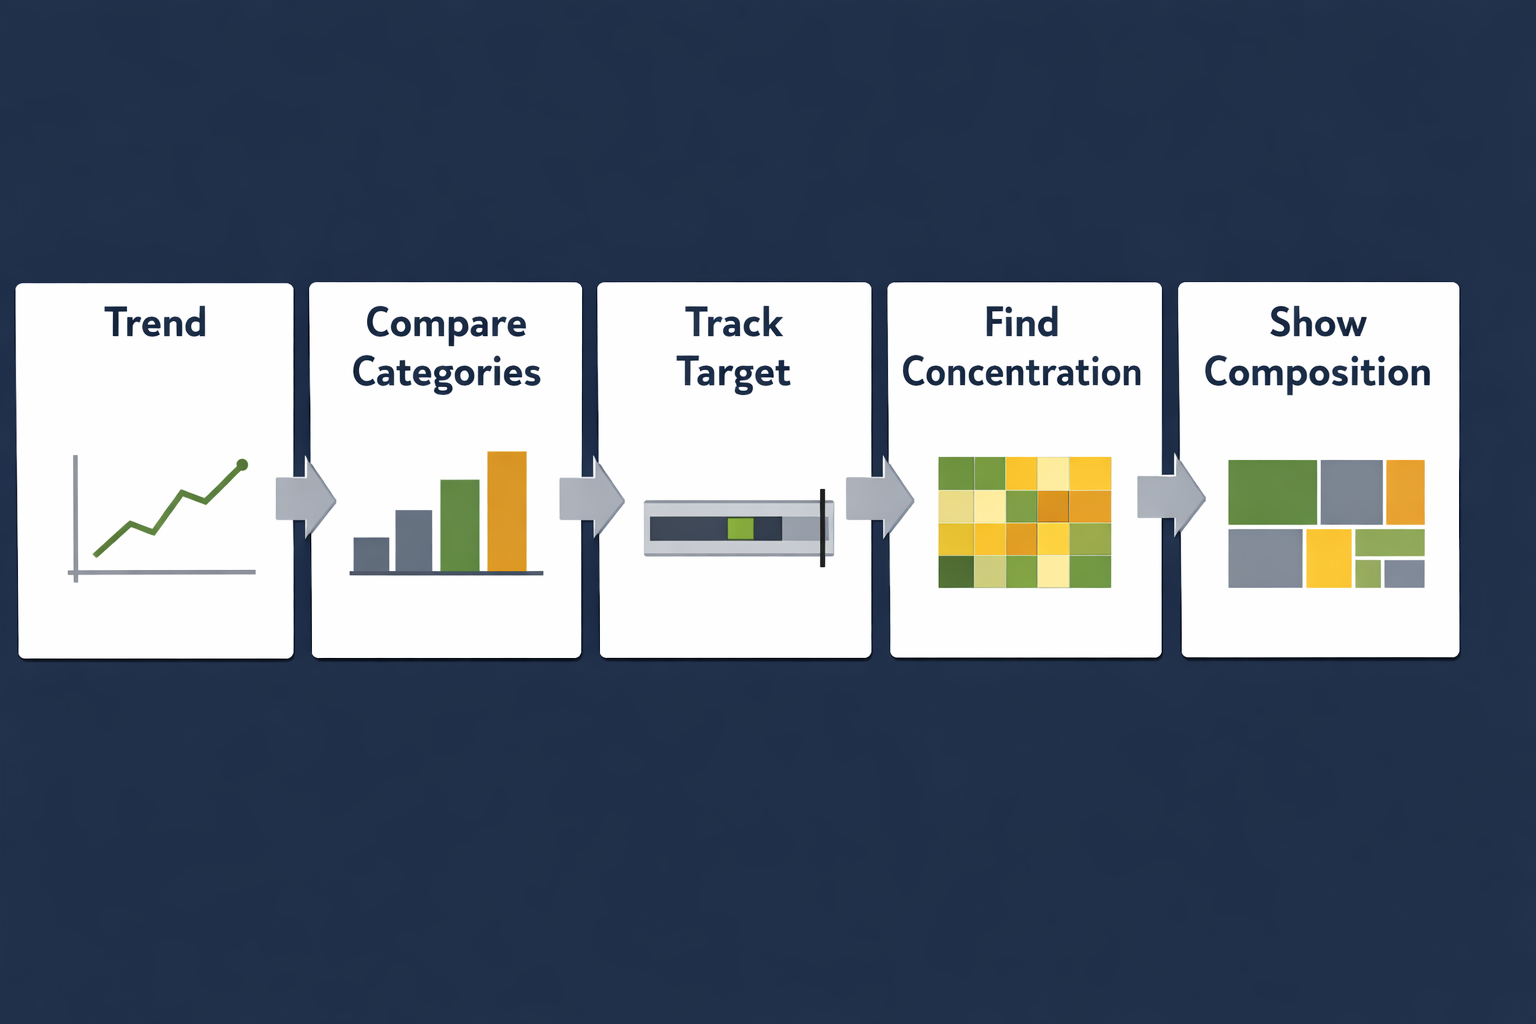
Start with the relationship you need to communicate, not with the chart that looks most interesting. Use this decision guide:
| Your question | Usually suitable | Common mistake |
|---|---|---|
| How is a value changing over time? | Line chart or compact area chart | Using a gauge that hides the trend |
| Which categories are largest or smallest? | Sorted bar chart | Using many slices in a pie chart |
| Is performance on target? | Bullet chart, bullet graph, or bar with a target line | Showing a number without its goal |
| Where are problems concentrated? | Heat map chart | Using color without a legend or threshold |
| How do parts make up a whole? | Stacked bar, treemap chart, or tree map | Showing too many small segments |
| How do two measures relate? | Scatter plot or bubble chart | Encoding too many variables at once |
| How are systems or entities connected? | Graph visualization | Using a network graph for simple totals |
| What is the current state? | KPI card, status indicator, or small bar | Filling the screen with decorative gauges |
Line charts for trends#
Use a line chart when the order of values matters and viewers need to see movement over time. It works well for response time, throughput, incidents, energy use, attendance, or service availability.
For a dashboard screen:
- Use one clear time range.
- Limit the number of lines.
- Label important endpoints or thresholds.
- Avoid smoothing that could hide real changes.
- Make missing data visibly different from zero.
A line chart is less useful when the viewer only needs the latest value. In that case, pair a prominent current-value indicator with a small trend rather than giving the trend most of the screen.
Bar charts for comparisons#
Bar charts are often the safest default for comparing categories. Sorting bars from largest to smallest helps viewers understand the ranking without searching across the chart.
Use horizontal bars when category names are long. Keep the number of categories limited, or group smaller categories into an explicit “Other” category. Do not hide a long list behind tiny labels simply to fit more data on the screen.
Bullet charts and bullet graphs for target tracking#
A bullet chart, also called a bullet graph, combines a primary measure with a target and qualitative ranges such as poor, acceptable, and strong. It is useful when the viewer needs to know not only the current value but whether it meets an expectation.
For example, a support dashboard might show:
- Current average response time.
- The response-time target.
- A background range indicating acceptable performance.
Keep the ranges meaningful. A bullet chart with several nearly indistinguishable bands can be harder to read than a simple bar and target marker.
Heat maps for patterns across two dimensions#
A heat map chart uses color intensity to show values across a grid, such as incidents by hour and day, machine status by location, or website traffic by weekday and hour.
Heat maps are useful for spotting concentration and recurring patterns. They are not ideal when viewers need to read exact values from every cell. Use a clear legend, sufficient contrast, and a color scale that remains understandable to people with color-vision deficiencies. Consider adding labels or an alternative table when exact values matter.
Treemaps for hierarchical parts of a whole#
A treemap chart, also written as a tree map, uses nested rectangles to show hierarchy and relative size. It can help show how a portfolio, budget, storage allocation, or product mix is distributed.
Treemaps are dense. They work best when the audience needs an overview of composition, not precise comparison between similarly sized items. Limit nesting, label only important regions, and avoid using area, color, and position to encode too many unrelated measures.
Bubble charts for three-variable comparisons#
A bubble chart can represent two numeric measures with position and a third measure with bubble size. Color may add a fourth dimension, but that does not mean it should.
Bubble size is difficult to compare precisely, particularly at a distance. Use bubble charts to reveal broad clusters or outliers, not to support exact ranking. If the audience needs an accurate comparison, a sorted bar chart may communicate more effectively.
Graph visualizations for relationships#
Graph visualization represents entities as nodes and relationships as connecting lines. It can be useful for dependencies, network paths, organizational relationships, or system architecture.
Network graphs become difficult to read when too many nodes overlap. On a shared screen, show a focused subset, highlight the important path, or use a simpler status summary. A graph visualization should explain a relationship, not merely display every available connection.
Data visualization tools and BI platforms#
Data visualization tools differ in their data connectors, modeling features, chart libraries, sharing options, refresh behavior, permissions, and customization. Those capabilities matter, but they are only part of the decision.
When evaluating data visualization tools, ask two separate questions:
- Can the tool produce the analysis or chart you need?
- Can the resulting view remain readable and dependable on the intended screen?
A tool may offer dozens of chart types while still producing a poor shared-screen dashboard if its default layouts are crowded or its important status information is buried in interaction controls.
Evaluate tools against these criteria:
- Data connectivity: Can it access the systems and files you actually use?
- Refresh behavior: Can viewers tell when data was last updated?
- Layout control: Can you create a clear hierarchy at the target screen ratio?
- Responsive behavior: Does the view remain usable at the display’s resolution?
- Permissions: Can the screen display data without exposing more than intended?
- Reliability: What happens when data, authentication, or the network is unavailable?
- Embedding or display workflow: Can the visualization be shown consistently on a dedicated screen?
- Accessibility: Are labels, contrast, and status cues understandable without relying on color alone?
Tableau, Power BI, Excel, and other business intelligence platforms can all support different visualization workflows. Their suitability depends on the data, audience, maintenance model, and display environment—not simply on the number of built-in visuals.
If your next step is putting an existing BI view on a shared display, Variabl’s guide to displaying Tableau business dashboards on digital signage provides a platform-specific deployment path. For other web-based dashboards, review the guide to displaying Plotly dashboards on digital signage.
Designing visualizations for dashboard screens#
Plan for viewing distance#
A chart that is comfortable on a laptop may be unreadable across a room. Before finalizing the layout, stand at the approximate viewing distance and check:
- Can the main message be understood in a few seconds?
- Are labels large enough to distinguish without approaching the screen?
- Are legends close enough to the data they describe?
- Can someone identify an exception without hovering over it?
- Are there enough margins around the most important content?
If viewers are mobile, such as on a factory floor or in a hallway, prioritize large status indicators and short labels. If viewers are seated nearby, you can provide more supporting detail.
Respect screen aspect ratio#
A dashboard designed for a wide desktop monitor may become cramped on a portrait display or a different television ratio. Design around the actual screen orientation and resolution where possible.
Avoid relying on a dashboard’s automatic scaling to solve layout problems. Scaling can make labels too small, compress chart spacing, or push important content below the visible area.
Use color as a supplement, not the only signal#
Color can establish hierarchy and highlight exceptions, but it should not be the sole way to distinguish states. Pair color with labels, icons, position, patterns, or direct annotations.
Reserve strong accent colors for information that deserves attention. If every card is brightly colored, none of them appears urgent.
Show refresh context#
A current value without a timestamp can be misleading. Include a visible “last updated” time or an equivalent freshness indicator when the age of the data affects decisions.
Do not imply real-time accuracy if the source updates periodically. A visualization should make its refresh limitations clear enough for the audience to interpret it responsibly.
Reduce dashboard density#
Removing a chart can improve the dashboard more than adding another filter. For each visual, ask:
- What decision does this support?
- Who needs it?
- What should the viewer do when it changes?
- Is another visual already communicating the same information?
If the answer is unclear, move the visual to a detailed report or remove it from the shared-screen view.
For broader guidance on the physical display environment, see how to choose a monitor for digital signage dashboard displays. Screen brightness, size, placement, and viewing distance can affect whether an otherwise well-designed visualization is usable.
Examples of effective and ineffective dashboard visualizations#
Example: operations response time#
Less effective: A dashboard shows six gauges for response time across teams. Each gauge uses a different scale, and none shows the target or time period.
More effective: A sorted bar chart compares teams using the same scale, includes a target marker, and shows the current reporting period. A compact trend beside it shows whether performance is improving or deteriorating.
The second design supports comparison and action. It also avoids making viewers decode several unrelated gauges.
Example: incident concentration#
Less effective: A heat map uses red, orange, yellow, and green without a legend. The cells are small, and the colors are the only indication of severity.
More effective: A heat map uses a labeled sequential scale, larger cells, a clear time range, and a short annotation identifying the busiest period. The dashboard also includes a count of open incidents so the pattern is not mistaken for the current total.
Example: sales or inventory composition#
Less effective: A treemap contains dozens of unlabeled rectangles with similar colors and no indication of the hierarchy.
More effective: A treemap groups a small number of meaningful categories, labels the largest areas, and uses color for a clearly explained secondary measure. A nearby total provides context.
These examples illustrate a general principle: a chart type is not effective by itself. Context, scale, labeling, and the viewer’s task determine whether it works.
A practical data-visualization checklist#
Before publishing a visualization to a dashboard screen, check the following:
Message#
- Is the question or decision clear?
- Does the title describe the insight rather than merely naming the metric?
- Is the most important information visually dominant?
Chart choice#
- Does the chart match the relationship being shown?
- Would a simpler chart communicate the same point?
- Are comparisons made using consistent scales?
Readability#
- Can viewers read labels from the expected distance?
- Are legends, units, targets, and thresholds visible?
- Does the design work in the actual screen orientation?
Accessibility#
- Is color supported by labels, position, icons, or patterns?
- Is contrast sufficient?
- Are small text and thin lines limited?
Data context#
- Is the time period clear?
- Is the last refresh time visible where it matters?
- Are missing, delayed, or partial data states distinguishable?
Operations#
- Does the display have a clear recovery path if the source page or network fails?
- Are permissions appropriate for a shared screen?
- Has the view been checked after resizing or changing the display resolution?
A dashboard display should make the next decision easier, not simply make data visible. Choose the chart that matches the question, remove detail that cannot be read at a glance, and test the result in the environment where people will actually see it.
Frequently Asked Questions#
What is the best chart for a dashboard screen?#
There is no universal best chart. Use a line chart for trends, a bar chart for category comparisons, a bullet chart for target tracking, a heat map for two-dimensional patterns, and a treemap for high-level composition. Choose based on the viewer’s question and the available viewing distance.
Are treemaps suitable for shared dashboard displays?#
They can be useful for showing hierarchy and relative composition, but they are not ideal for precise comparisons between similarly sized items. Limit the number of levels and labels, and provide context such as totals or clear group names.
When should I use a bullet chart instead of a gauge?#
Use a bullet chart when the viewer needs to compare a value with a target or performance range. It generally uses space efficiently and supports comparison across categories. A gauge may be appropriate for a single, highly prominent status, but multiple gauges can consume space without making comparison easy.
Can a bubble chart work on a digital signage screen?#
Yes, when the goal is to show broad relationships, clusters, or outliers. Bubble size is difficult to compare precisely, so use direct labels or a different chart when viewers need exact rankings.
What should I look for in data visualization tools?#
Consider data connectivity, refresh behavior, permissions, layout control, accessibility, responsive behavior, and the workflow for displaying the result on a dedicated screen. A large chart library does not guarantee a readable dashboard.
How can I display a web-based visualization on a dedicated screen?#
Use a screen-management or digital-signage workflow that can load the approved dashboard URL and keep it visible in the intended layout. Test authentication, refresh behavior, network interruptions, and the display’s resolution before relying on it for operational decisions.