
author: name: "Sam Reed" picture: "/author/sam.png" cover_image: "/assets/blog/display-aws-service-health-cloudwatch-dashboards-cover.jpg"#
A screen showing AWS status information can help an operations team notice service issues quickly—but only if the screen shows the right AWS view, stays authenticated, and makes the information readable from a distance.
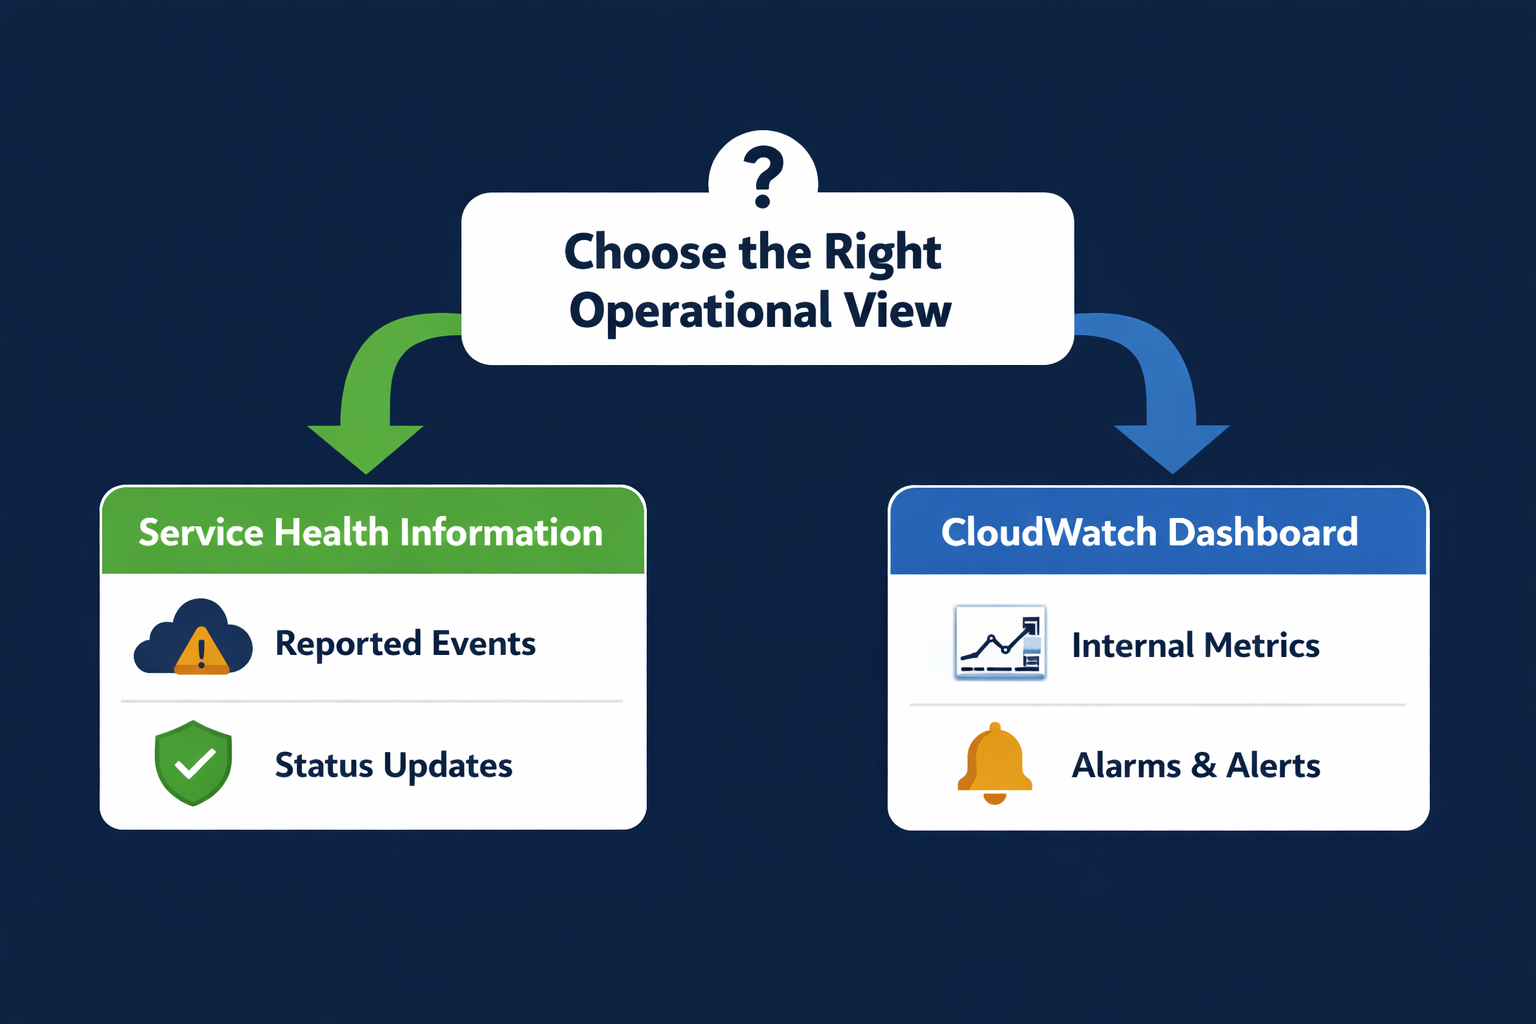
The short answer is to treat this as two related display projects:
- Use an AWS service-health view when the goal is to show AWS-reported incidents, service events, or account-relevant health information.
- Use a CloudWatch dashboard when the goal is to show metrics, alarms, logs-derived results, or application and infrastructure performance.
- Before putting either view on an unattended screen, verify authentication, permissions, session expiry, data freshness, sensitive information, and browser behavior.
A digital signage tool that can display a web URL can provide the screen-management layer. For example, Variabl’s guide to adding a web URL is a relevant starting point for teams planning to display a browser-accessible AWS view. The AWS account, permissions, authentication method, and suitability of the destination still need to be evaluated separately.
AWS service health versus CloudWatch dashboards#
These terms are sometimes used interchangeably, but they answer different operational questions.
| View | Main question | Typical use on a shared screen |
|---|---|---|
| AWS service-health information | Is AWS reporting an issue or event affecting a service, account, or region? | Cloud-status awareness and incident context |
| CloudWatch dashboard | What are our systems and applications doing right now? | Metrics, alarms, latency, errors, capacity, and performance |
| AWS status dashboard | What is the broad public status of AWS services? | High-level external status reference |
| Custom operational dashboard | What does our team need to act on? | A combined view of service status and internal signals |
The important distinction is that a public AWS status page is not the same thing as account-specific health information. Likewise, a CloudWatch dashboard is not automatically an AWS-wide service-status dashboard. Choose the view based on the decision the person watching the screen needs to make.
When AWS service-health information belongs on a shared screen#
An AWS service-health display can be useful when a cloud, platform, or NOC team needs a common reference during operational work. It may help answer questions such as:
- Is a reported AWS event relevant to a region or service we use?
- Could an external AWS issue explain a sudden application symptom?
- Is the team waiting for a provider-side update during an incident?
It should not be the only source of truth for an incident. A shared display is easy to see, but it may not contain the detailed context, event history, affected resources, or remediation guidance available in an authenticated console or incident-management system.
Keep the screen focused on awareness. Detailed investigation should happen in an approved, access-controlled workspace.
Choose the right view for an operational display#
Start with the question, not the keyword.
Choose service-health information when external status matters#
Use a service-health view when the screen is intended to provide context about AWS-reported events or service availability. Confirm whether the selected view is public, account-specific, regional, or filtered by services and resources.
A public status view may be easier to display, but it can be too broad for a team that needs account-specific information. An account-specific view may be more useful, but it introduces authentication and confidentiality concerns.
Choose CloudWatch when internal telemetry matters#
A CloudWatch dashboard is usually the better fit when the screen needs to show operational measurements such as request errors, response latency, CPU utilization, queue depth, or alarm state. Decide which metrics support action and remove decorative or redundant charts.
Do not assume that a CloudWatch dashboard shows every event your team needs. Metrics, alarms, logs, traces, deployment status, and AWS service events may come from different sources and have different update behavior.
Teams comparing monitoring-screen layouts may also benefit from Variabl’s command-center dashboard display guide, especially when deciding which information belongs on a shared operational wall rather than on an individual engineer’s screen.
Protect account information and sensitive operational details#
An unattended screen changes the security model. People who are not authorized to use the AWS account may be able to see the display, photograph it, or infer details from labels and charts.
Before displaying an authenticated AWS page, review:
- Account names, account IDs, resource names, hostnames, and URLs.
- Customer, tenant, or project identifiers.
- Internal IP addresses, deployment names, and environment labels.
- Error messages that reveal application behavior or data.
- Alarm descriptions, incident notes, and operational comments.
- Anything that could disclose security controls or business-sensitive capacity information.
Use the least-sensitive view that satisfies the operational need. If the audience includes visitors, contractors, or other teams, a sanitized summary may be more appropriate than a full console page.
A screen should not become a shortcut around normal access controls. Do not place long-lived credentials, access keys, or passwords in a URL, page content, signage configuration, or browser automation workflow.
Check authentication, permissions, and session expiry#
The phrase “AWS service health dashboard API” can imply that every dashboard or health view has a simple public API. That assumption needs verification before implementation.
Separate these questions:
- What data do you need? Public status, account-specific health events, CloudWatch metrics, alarms, or a combined summary?
- Which AWS service or interface provides it? A console page, documented API, SDK, or another approved integration may have different access rules.
- Can the display retrieve it without exposing credentials? A browser session that works for a person may not be suitable for an unattended device.
- What happens when the session expires? The screen might show a sign-in page, an error, a blank frame, or old content.
- Who is allowed to see the result? Authentication protects data, but physical placement still affects confidentiality.
Use a dedicated, least-privileged identity where the approved AWS integration supports one. Have the cloud-security owner review the design. Avoid sharing a personal administrator session across screens.
If the page requires multifactor authentication, conditional access, a VPN, or an interactive login, confirm that unattended operation is supported by your organization’s policy. Do not weaken authentication merely to keep a display online.
For broader screen-management considerations, Variabl’s setup screens documentation can help with the display side of the workflow, while AWS access decisions should remain under your organization’s security and cloud-governance process.
Plan refresh and data-freshness expectations#
A dashboard can be visible without being current. A browser page may remain on screen while its underlying data stops updating, a session expires, or a network path fails.
Define the freshness requirement before choosing a refresh approach:
- Awareness display: periodic updates may be sufficient if the screen is clearly labeled with its last update time.
- Incident response: the team may need faster updates and a visible indication when data is stale.
- Capacity or performance monitoring: the acceptable delay depends on the operational decision being made.
Do not infer freshness from a moving clock or a page that looks active. Validate the actual data timestamp, metric period, alarm state, or update indicator where available.
A useful display should make stale data obvious. Consider showing a last-updated value, a connection state, or a separate monitoring check. If the underlying AWS view does not expose a reliable freshness indicator, document the refresh assumption and test it under normal network conditions.
Design the dashboard for distance viewing#
A console designed for an engineer at a desk may not work well on a wall-mounted screen. Prioritize the information people need to recognize quickly.
Use these design principles:
- Put the most important service, region, or alarm state in the largest visual area.
- Remove panels that require hovering, scrolling, or opening a detail view.
- Use short labels and clear units.
- Avoid relying on color alone; pair color with text, icons, or state labels.
- Keep contrast high and avoid dense tables with tiny values.
- Test the layout at the actual viewing distance and screen resolution.
- Include a visible timestamp or freshness indicator where possible.
If the AWS console layout is too dense or changes frequently, consider displaying a purpose-built summary instead of the full console. A summary can be easier to read and safer to expose, but it must preserve enough context for viewers to interpret the status correctly.
Test the display under unattended conditions#
Do not stop testing when the page first loads. Run a realistic unattended test that includes:
- Load the selected AWS view on the intended device and screen size.
- Confirm that the expected account, region, services, and filters are visible.
- Leave the display running for longer than the expected session duration.
- Check what appears after a network interruption or browser reload.
- Confirm that the page does not expose a sign-in form or sensitive error details to the audience.
- Verify that data timestamps or metric values continue to update as expected.
- Inspect the display from its normal viewing distance.
- Confirm who receives an alert if the page becomes blank, stale, cropped, or signed out.
This test should be repeated after changes to AWS permissions, identity policies, browser settings, dashboard layouts, or screen-management configuration.
Troubleshoot blank, stale, cropped, or signed-out views#
The page is blank#
Check the network path, browser compatibility, blocked scripts, DNS resolution, and whether the destination requires an interactive login. A blank page does not prove that AWS is unavailable.
The dashboard is signed out#
Treat this as an authentication or session-management issue. Confirm the approved sign-in flow and session duration. Do not store personal credentials on the screen or disable required security controls.
The data looks stale#
Compare the visible timestamp with the source view in an authorized workstation. Check the metric period, page refresh behavior, network connectivity, and whether the dashboard is showing cached content.
The view is cropped or hard to read#
Review browser zoom, device resolution, responsive layout, and dashboard panel sizing. Remove nonessential panels rather than shrinking everything until it becomes unreadable.
The wrong account or region is shown#
Check the selected account, role, region, filters, and saved dashboard configuration. Make the account or environment context visible enough for viewers to identify what they are looking at.
AWS dashboard display checklist#
Before publishing an AWS status dashboard or CloudWatch view to a shared screen, confirm:
- The display has a defined operational purpose.
- The selected view matches that purpose.
- Public, account-specific, and internal data have been distinguished.
- Security and cloud-governance owners have approved the access method.
- No credentials or sensitive values are exposed unnecessarily.
- Permissions follow least-privilege principles.
- Session expiry and reauthentication behavior are understood.
- Data freshness has been defined and tested.
- The layout is readable at the actual viewing distance.
- Blank, stale, offline, and signed-out states have an owner.
- The screen has been tested after an unattended run.
The best AWS service-health dashboard for a shared screen is not necessarily the most detailed one. Choose the least-sensitive, clearest view that gives the intended audience enough current information to make the next operational decision.
Frequently asked questions#
Can I display an AWS service-health dashboard on a dedicated screen?#
Potentially, but first confirm whether the selected AWS view is public or requires an authenticated account session. Then verify that unattended access, session duration, permissions, and organizational security policies support the planned setup.
Is an AWS status dashboard the same as a CloudWatch dashboard?#
No. An AWS status or service-health view generally focuses on AWS-reported service events or availability information. A CloudWatch dashboard focuses on metrics, alarms, and telemetry for monitored resources and applications.
Is there an AWS service health dashboard API?#
The correct API or integration depends on the data you need and the AWS service involved. Do not assume that a browser dashboard has an equivalent public API or that API credentials are appropriate for a signage device. Verify the current AWS documentation and your organization’s approved access pattern before implementation.
Can I show an authenticated AWS console page on an unattended screen?#
Only if the authentication method, permissions, session behavior, physical placement, and organizational policies make it appropriate. A personal administrator session or a display that reveals sensitive account information is not a safe default.
How often should an AWS dashboard refresh on a shared screen?#
There is no single correct interval. Set it according to the operational decision, the source data’s update behavior, and the consequences of stale information. Always make stale or disconnected states visible when possible.